
Conventional practices for the measurement of surface or deep deformation phenomena, such as levelling surveys and GPS, provide very accurate point information over limited areas. Geophysic prospects additionally provide to geologists quantitative information about structure and composition of deep lithospheric strata. If this type of information is needed continuously over extended areas, or in remote areas, or for Earth movements occurred in the past, the conventional methods are hardly or not at all applicable.
Although complex, the processing of Differential Interferometric Synthetic Aperture Radar (DInSAR) data is, at large extent automated, providing accurate and cost-effective products in reduced time. This technology, applied to temporal data stacks acquired from existing SAR sensors at different resolutions and wavelengths, enables to detect and monitor different kind of land displacements. From continuous small movements such as slow subsidence, land sliding/creeping or failures in antropic structures,
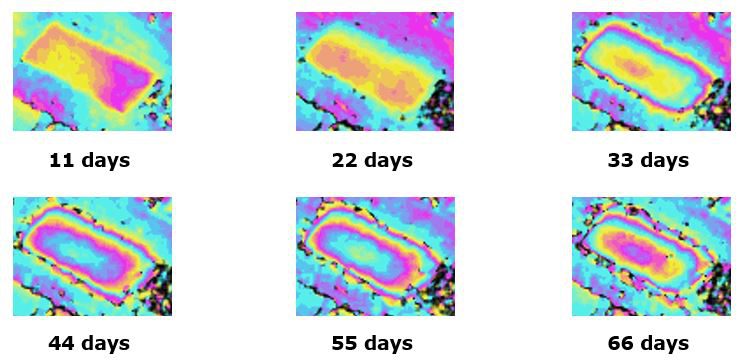
This example shows 6 differential interferograms, on a building construction area, generated using TerraSAR-X-1 (3 metres resolution) data pairs acquired at increasing time distances: it appears clearly that, moving from the upper left to the lower right interferogram, the displacement increases proportionally to the time span. In order to interpret a differential interferogram we can assume that the density of contour lines, each one being represented by a red-to-blue colour cycle (known as interferometric fringe), is proportional to the displacement magnitude. Each fringe represents a displacement equal to half the observation wavelength (1.55 cm in this case).
to episodic large deformations such as those triggered by seismic events.
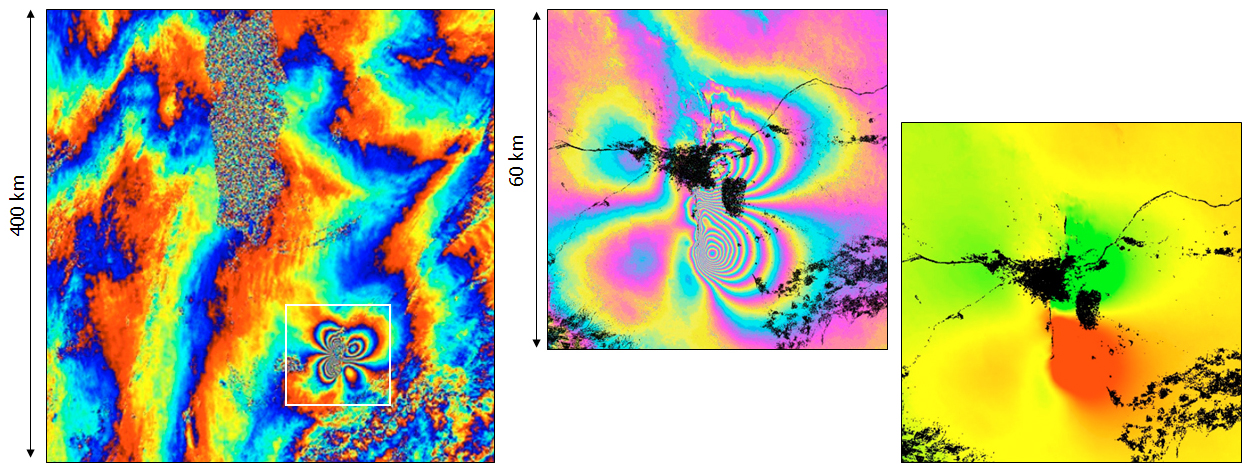
The 6.3 Richter scale magnitude earthquake, which devasted the Iranian oasis town of Bam, on December 26th 2003, has been studied and modelled using ENVISAT ASAR data acquired in ScanSAR (90 metres resolution; 400 by 400 kilometres scene coverage) and StripMap (25 metres resolution; 100 by 100 kilometres scene coverage) modes. The area bordered by a white square in the ScanSAR interferogram (left image) can be observed in detail in the StripMap interferogram (central image) and Displacement Map (right image). This last product is here represented in false colours which are scaled from yellow to green – or from yellow to red – respectively proportionally to the ground displacement magnitude towards – or away from – the satellite, along the satellite viewing direction.
Spaceborne SAR data acquired in an interferometric way over a very short time span (28 minutes) have been exploited to observe and track fast moving glaciers and sea ice in polar regions.
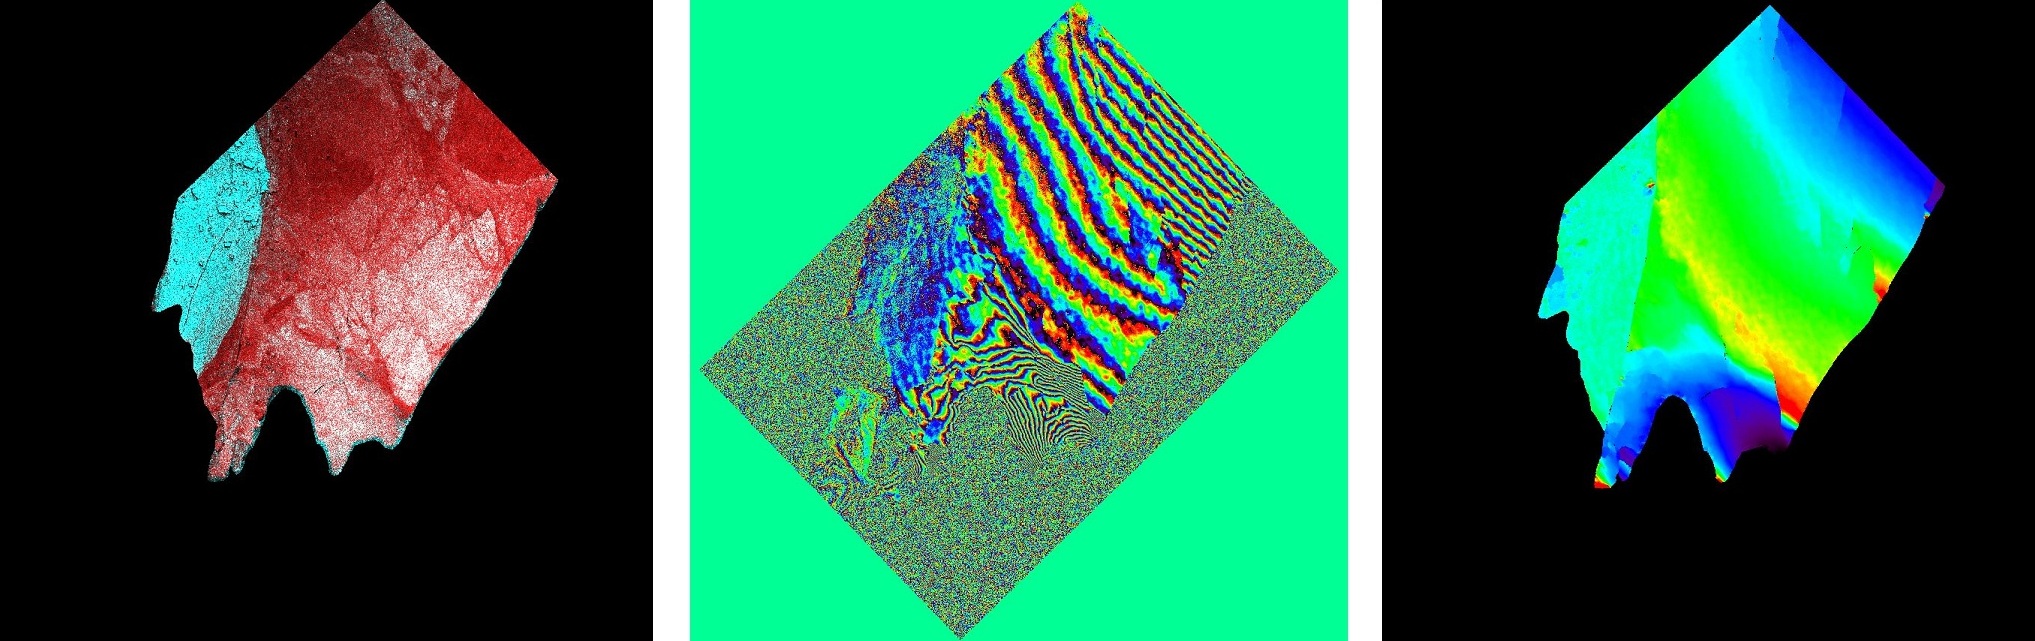
This example shows the coherence-intensity-intensity change color composite (left image) generated from a SAR pair acquired 28 minutes apart over the Antartica (Lassiter Coast) by the ERS-2 and ENVISAT satellites (25 metres resolution). The interferogram (center image) makes evident the type of information which can be gathered using this technique. Note the extremely fast movement of the land ice towards the sea: each fringe corresponds to a displacement of 2.8 cm. The absolute displacement (blue corresponds to -60 cm, red to +30 cm) has been calculated and displayed in the right image.
Finally, small terrain displacements can be detected and monitored over long time periods exploiting Interferometric Stacking techniques (Persistent Scatterers and Small Baseline Subset), based on SAR data obtained from the different currently available spaceborne missions. Terrain displacement maps can be generated in the order of one mm/year for the measurement of the average displacement rate. In addition, the availability of long time-series enables to monitor the complete evolution of the terrain over the period, differentiating among various (e.g. linear vs. non linear) behaviors.
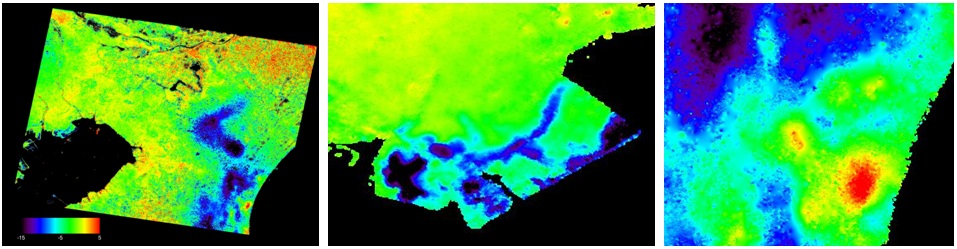
Average displacement rate (color scale between -15 and +5 mm/year) of an area around the cities of Tokyo and Chiba, Japan, derived from ALOS PALSAR data in the period 2006-2010. Whole area (left), a region of terrain compaction over landfill (center), uplift due to too much water injection after natural gas extraction (right).
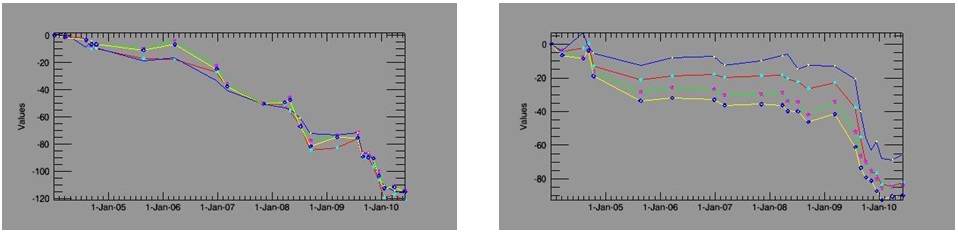
Location time series of groups of terrain points in a same area showing different temporal behaviors. Points showing linear trends (left), and points with significant non-linearities (right); vertical scale in [mm].
Publications
P. Pasquali, A. Cantone, M. Barbieri, M. Engdahl, ERS-ENVISAT Tandem Cross-Interferometry for monitoring of sea ice, IGARSS Symposium, Hawaii, 2010.
Z. Li, P. Pasquali, A. Cantone, A. Singleton, G. Funning, D. Forrest, MERIS atmospheric water vapor correction model for Wide Swath Interferometric Synthetic Aperture Radar, IEEE Geoscience and Remote Sensing Letters, 2011.
S. Atzori, C. Tolomei, A. Antonioli, J.P. Merryman Boncori, S. Bannister, E. Trasatti, P. Pasquali, S. Salvi, The 2010-2011 Canterbury, New Zealand, seismic sequence: Multiple source analysis from InSAR data and modeling, Journal of Geophysical Research: Solid Earth, Vol. 117, Issue B8, 2012.
S. Atzori, P. Pasquali, A. Cantone, M. De Filippi, P. Riccardi, F. Ogushi, A. Meroni, An integrated software package for the measurement, monitoring and modelling of geophysical phenomena, Asia-Pacific Conference on Synthetic Aperture Radar, Japan, 2013.
F. Holecz, P. Pasquali, N. Milisavljevic, D. Closson, Land applications of radar remote sensing – Chapter 8, INTECH, http://www.intechopen.com/books/land-applications-of-radar-remote-sensing, 2014.
V. Cerchiello, G. Tessari, E. Velterop, P. Pasquali, Risk of Building damage by modelling interferometric time series, Proceeding of IGARSS, Beijing, 2016.
G. Tessari, P. Pasquali, M. Floris, Monitoring and modelling of sinkholes affecting the Jordanian coast of the Dead Sea through satellite interferometric techniques, EGU General Assembly, vol. 18, Wien, 2016.
G. Tessari, E. Velterop, P. Pasquali, M. Floris, Using high-resolution SAR data to monitor deformations at a very detailed scale, Soc. Geol. It., Vol. 41, 2016.
G. Tessari, M. Floris, P. Pasquali, Phase and amplitude analyses of SAR data for landslide detection and monitoring in non-urban areas located in the North-Eastern Italian pre-Alps, Environ Earth Sci 76: 85. doi:10.1007/s12665-017-6403-5, 2017.
V. Cerchiello, G. Tessari, E. Velterop, P. Riccardi, M. Defilippi, P. Pasquali, Building damage risk by modelling interferometric time series, IEEE Geoscience and Remote Sensing Letters, February, 2017.
F.F. Gama, A. Cantone, J.C. Mura, P. Pasquali, W.R. Paradella, A.R. dos Santos, G.G. Silva, Monitoring subsidence of open pit iron mines at Carajas Province based on SBAS interferometric technique using TerraSAR-X data, Remote Sensing Applications: Society and Environment, Volume 8, 2017.